DocumentationTraces
Traces
See every LLM and agent call your workspace makes — what it did, what it cost and how good it was.
Traces records each request your LLM and agent applications make, step by step, with its cost, latency and scores. Each workspace is one Traces project.
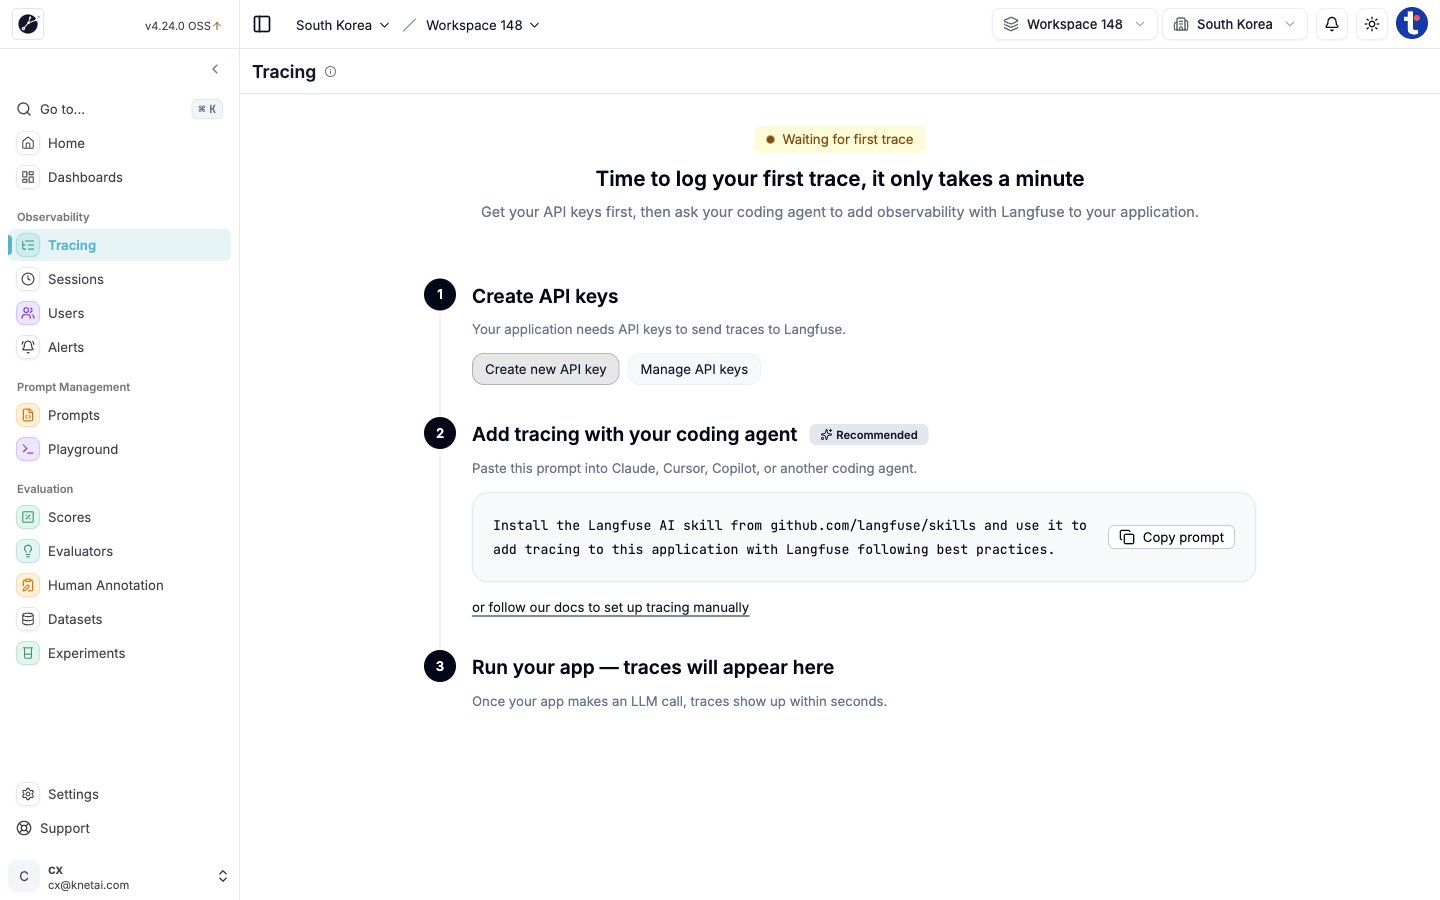
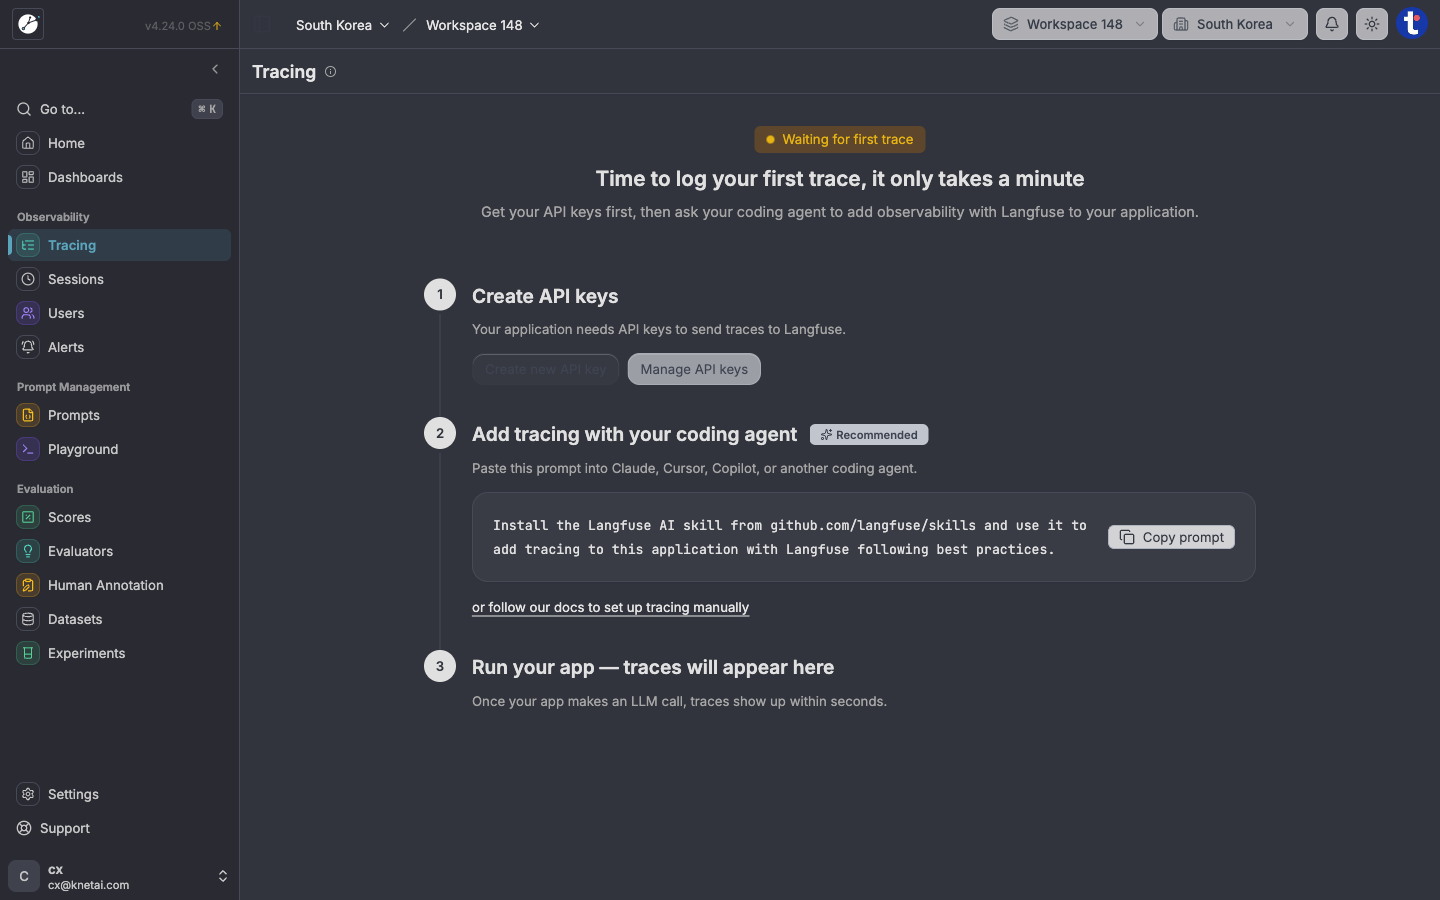
Quick Setup
Getting traces flowing into your project takes three steps right from the interface:
- Create API keys: Generate your public and secret keys (
pk-lf-traces-...andsk-lf-traces-...). - Add tracing with your coding agent: Copy the guided prompt into Claude, Cursor, or Copilot to instrument your app with standard SDK calls.
- Run your app: Traces, tokens, and model latencies appear in real time on the Tracing dashboard.
Pages
| Group | Pages |
|---|---|
| Overview | Home (traces, token volume, and costs), Dashboards (custom charts and latency percentiles) |
| Observability | Tracing (every LLM call, span, and step), Sessions (traces grouped into multi-turn conversations), Users (cost and token usage per user), Alerts (latency or error thresholds) |
| Prompt management | Prompts (version, label, and deploy prompts without redeploying code), Playground (compare models side by side) |
| Evaluation | Scores (user feedback and numeric evaluations), Evaluators (automated LLM-as-a-judge), Human Annotation (review queues), Datasets, Experiments |
| Project Tools | Quick Search (⌘ K), Settings (API keys, team members), Support |